
DAX OR Function

The DAX OR function in Power BI is used to perform a logical disjunction on two expressions. It returns TRUE if either of the expressions evaluates to TRUE, and FALSE only if both expressions are FALSE. This function is useful for combining multiple conditions where at least one condition must be met.


Syntax:

OR(<logical1>, <logical2>)

<logical1>: The first condition to evaluate.

<logical2>: The second condition to evaluate.


Purpose:

The OR function allows you to test multiple conditions and return TRUE if any one of the specified conditions is TRUE. This is essential for scenarios where you need to check if at least one of several criteria is satisfied.


Example:

Suppose you have a table named "Sales" with columns "Product", "Revenue", and "UnitsSold". You want to create a new column that flags sales as "High Priority" if the revenue is greater than 200 or the units sold are greater than 50.

You can use the OR function as follows:

HighPriority = IF(OR(Sales[Revenue] > 200, Sales[UnitsSold] > 50), "Yes", "No")

This formula creates a new column named "HighPriority" that assigns "Yes" if either condition is true, and "No" otherwise.


Example Scenario:

Consider the following "Sales" table with columns "Product", "SalesAmount", and "Cost":


We want to create a new calculated column called "SpecialDeal" that indicates whether the sales amount is greater than 150 or the cost is less than 100.

Using the OR function directly:

SpecialDeal = OR(Sales[SalesAmount] > 150, Sales[Cost] < 100)


This will return TRUE or FALSE directly.


Combining OR with IF Function

For a more meaningful result, we can combine the OR function with the IF function:

SpecialDeal_IF = IF(OR(Sales[SalesAmount] > 150, Sales[Cost] < 100), "Eligible for Special Deal", "Not Eligible for Special Deal")


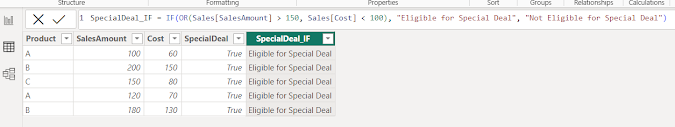
In this example, rows where the sales amount is greater than 150 or the cost is less than 100 are labeled "Eligible for Special Deal". If both conditions are false, the row would be labeled "Not Eligible for Special Deal".

Comments

Popular posts from this blog

Power BI tenant settings and admin portal

As of my last update, Power BI offers a dedicated admin portal for managing settings and configurations at the tenant level. Here's an overview of Power BI tenant settings and the admin portal: 1. Power BI Admin Portal: Access : The Power BI admin portal is accessible to users with admin privileges in the Power BI service. URL : You can access the admin portal at https://app.powerbi.com/admin-portal . 2. Tenant Settings: General Settings : Configure general settings such as tenant name, regional settings, and language settings. Tenant Administration : Manage user licenses, permissions, and access rights for Power BI within the organization. Usage Metrics : View usage metrics and reports to understand how Power BI is being used across the organization. Service Health : Monitor the health status of the Power BI service and receive notifications about service incidents and outages. Audit Logs : Access audit logs to track user activities, access requests, and administrative actions wit...

Using bookmarks and buttons for navigation

Using bookmarks and buttons for navigation in Power BI allows you to create interactive experiences within your reports, guiding users through different views and sections. Let's walk through how to use bookmarks and buttons for navigation: Step 1: Create Bookmarks Navigate to the "View" tab : Open your report in Power BI Desktop and navigate to the "View" tab. Create Bookmarks : Select the elements (visuals, slicers, shapes, etc.) that you want to bookmark. Click on the "Bookmark" button in the "View" tab or right-click and select "Add bookmark". Name your bookmark and ensure the "Data" and "Display" options are selected if you want to capture filter states and visual display states. Repeat for Additional Views : Create bookmarks for each view or section of your report that you want to navigate to. Step 2: Create Buttons Insert Buttons : Go to the "Home" tab and click on the "Buttons" dropdow...

Understanding the Power BI ecosystem and workflow

Understanding the Power BI ecosystem and workflow involves getting familiar with the various components of Power BI and how they interact to provide a comprehensive data analysis and visualization solution. Here's a detailed explanation: Power BI Ecosystem The Power BI ecosystem consists of several interconnected components that work together to enable users to connect to data sources, transform and model data, create visualizations, and share insights. The main components are: Power BI Desktop Power BI Service Power BI Mobile Power BI Gateway Power BI Report Server Power BI Embedded PowerBI Workflow Here’s a typical workflow in the Power BI ecosystem: Step 1: Connect to Data Sources Power BI Desktop:  Connect to various data sources like Excel, SQL databases, cloud services, and more. Power BI Gateway:  If using on-premises data sources, install and configure the gateway for secure data transfer. Step 2: Data Transformation and Modeling Power BI Desktop:  Use Power Query...