
Pyhon Loop statements

Loops are a fundamental concept in Python that allow you to execute a block of code repeatedly. Python supports two types of loops: for loops and while loops. Here's a detailed overview of how to use loops in Python:

1. for Loops

The for loop in Python is used to iterate over a sequence (such as a list, tuple, dictionary, set, or string).

Basic for Loop


Iterating Over a String


Using range()

The range() function generates a sequence of numbers, which is useful for creating loops with a specific number of iterations.


Using range() with Start, Stop, and Step
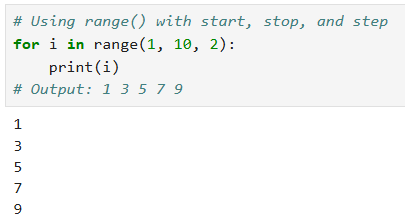


2. while Loops

The while loop executes as long as a specified condition is true.
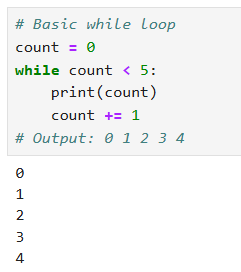
Basic while Loop


3. Control Statements in Loops

break Statement

The break statement is used to exit the loop prematurely when a certain condition is met.


continue Statement

The continue statement skips the current iteration and moves to the next iteration of the loop


else Clause with Loops

The else clause in a loop executes after the loop completes normally (i.e., not terminated by break).


Summary

  • for loop: Used for iterating over a sequence (list, string, etc.).
  • while loop: Repeats as long as a condition is true.
  • break statement: Exits the loop prematurely.
  • continue statement: Skips the current iteration.
  • else clause with loops: Executes after the loop completes normally.

Loops are essential for tasks that require repetitive execution of code, and mastering them will significantly enhance your ability to write efficient and effective Python programs.

Comments

Popular posts from this blog

Power BI tenant settings and admin portal

As of my last update, Power BI offers a dedicated admin portal for managing settings and configurations at the tenant level. Here's an overview of Power BI tenant settings and the admin portal: 1. Power BI Admin Portal: Access : The Power BI admin portal is accessible to users with admin privileges in the Power BI service. URL : You can access the admin portal at https://app.powerbi.com/admin-portal . 2. Tenant Settings: General Settings : Configure general settings such as tenant name, regional settings, and language settings. Tenant Administration : Manage user licenses, permissions, and access rights for Power BI within the organization. Usage Metrics : View usage metrics and reports to understand how Power BI is being used across the organization. Service Health : Monitor the health status of the Power BI service and receive notifications about service incidents and outages. Audit Logs : Access audit logs to track user activities, access requests, and administrative actions wit...

Using bookmarks and buttons for navigation

Using bookmarks and buttons for navigation in Power BI allows you to create interactive experiences within your reports, guiding users through different views and sections. Let's walk through how to use bookmarks and buttons for navigation: Step 1: Create Bookmarks Navigate to the "View" tab : Open your report in Power BI Desktop and navigate to the "View" tab. Create Bookmarks : Select the elements (visuals, slicers, shapes, etc.) that you want to bookmark. Click on the "Bookmark" button in the "View" tab or right-click and select "Add bookmark". Name your bookmark and ensure the "Data" and "Display" options are selected if you want to capture filter states and visual display states. Repeat for Additional Views : Create bookmarks for each view or section of your report that you want to navigate to. Step 2: Create Buttons Insert Buttons : Go to the "Home" tab and click on the "Buttons" dropdow...

Understanding the Power BI ecosystem and workflow

Understanding the Power BI ecosystem and workflow involves getting familiar with the various components of Power BI and how they interact to provide a comprehensive data analysis and visualization solution. Here's a detailed explanation: Power BI Ecosystem The Power BI ecosystem consists of several interconnected components that work together to enable users to connect to data sources, transform and model data, create visualizations, and share insights. The main components are: Power BI Desktop Power BI Service Power BI Mobile Power BI Gateway Power BI Report Server Power BI Embedded PowerBI Workflow Here’s a typical workflow in the Power BI ecosystem: Step 1: Connect to Data Sources Power BI Desktop:  Connect to various data sources like Excel, SQL databases, cloud services, and more. Power BI Gateway:  If using on-premises data sources, install and configure the gateway for secure data transfer. Step 2: Data Transformation and Modeling Power BI Desktop:  Use Power Query...