Data filtering in Power BI is a powerful feature that allows users to focus on specific subsets of data within their reports and dashboards. Filters can be applied at various levels, including visual, page, and report levels. Here's a detailed overview of data filtering in Power BI along with an example to illustrate how it works.
Types of Filters in Power BI
- Visual-Level Filters: Applied to individual visualizations. They filter the data used by a specific visual.
- Page-Level Filters: Applied to all visualizations on a specific report page.
- Report-Level Filters: Applied to all pages within a report.
Sample Dataset
Let's use a small mock dataset of sales data:
Load Data into Power BI
- Open Power BI Desktop.
- Click on "Get Data" and select "Text/CSV".
- Import the sample sales CSV file.

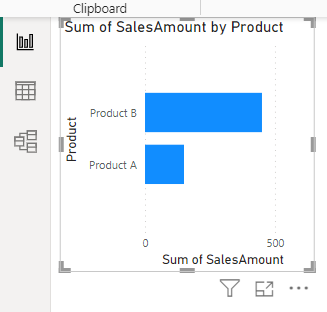
Create a Bar Chart
- Go to the "Report" view.
- In the "Visualizations" pane, select the bar chart visual.
- Drag "Product" to the Y axis field and "SalesAmount" to the X axis field.

Apply a Visual-Level Filter
- Click on the bar chart to select it.
- In the "Filters" pane, under "Visual level filters", drag "Region" to the filters area.
- Select "North America" to filter the chart data to only show sales for North America.


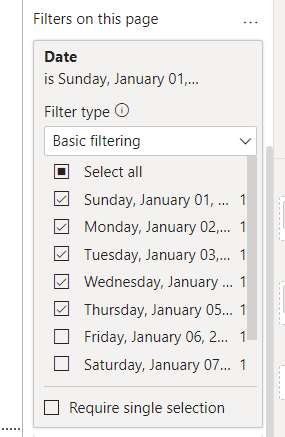
4. Apply a Page-Level Filter
- In the "Filters" pane, under "Page level filters", drag "Date" to the filters area.
- Set the date range to filter data, for example, from "2023-01-01" to "2023-01-05".
5. Apply a Report-Level Filter
- In the "Filters" pane, under "Report level filters", drag "SalesAmount" to the filters area.
- Set the filter to only include sales amounts greater than 100.


Comments
Post a Comment