
Hierarchies and data categorization

 Let's walk through an example of creating hierarchies and data categorization in Power BI using a sample dataset.


Example Dataset:

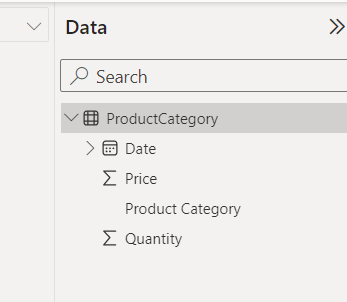
Let's consider a dataset containing sales data with the following columns:

  • Date: Contains transaction dates.
  • Product Category: Specifies the category of the product sold.
  • Quantity: Represents the quantity of products sold.
  • Price: Represents the price per unit of the product.


Hierarchies:

Hierarchies represent data in a structured format, typically organized from general to specific levels. For example, a date hierarchy can include levels like year, quarter, month, and day.

Let's create a date hierarchy:

Navigate to Data View:

    • Click on the "Table" view in Power BI Desktop.

Select the "Date" Column:
    • Identify the column containing date information.

Right-click on the "Date" Column:
    • Right-click on the "Date" column and select "Create Hierarchy".

Arrange Levels:
    • Arrange the levels of the hierarchy as Year > Quarter > Month > Day.

Use in Visualizations:
    • Once created, you can use this date hierarchy in visualizations to analyze sales trends over different time periods.


Data Categorization:

Data categorization involves assigning metadata or tags to your data to provide additional context or to group related items together. This is particularly useful for fields like geography or product categories.

Let's categorize the "Product Category" column:

Navigate to Data View:

    • Click on the "Table" view in Power BI Desktop.
                                 

Select the "Product Category" Column:
    • Identify the column containing product category information.

Right-click on the "Product Category" Column:
    • Right-click on the "Product Category" column and select "Mark as Category".

Example Visualizations:

Now, you can create various visualizations using these hierarchies and data categorization. For instance:

  • A line chart showing sales trends over time, with the ability to drill down from year to month using the date hierarchy.
  • A bar chart displaying total sales by product category, leveraging the categorized "Product Category" column.

Benefits:

By creating hierarchies and categorizing data in Power BI, you can:

  • Easily navigate through time periods or hierarchical data structures.
  • Group and analyze data by categories for better insights.
  • Create interactive reports with drill-down capabilities for deeper analysis.

These features enhance the usability and effectiveness of your Power BI reports, making it easier to derive actionable insights from your data.

Comments

Popular posts from this blog

TechUplift: Elevating Your Expertise in Every Click

  Unlock the potential of data with SQL Fundamental: Master querying, managing, and manipulating databases effortlessly. Empower your database mastery with PL/SQL: Unleash the full potential of Oracle databases through advanced programming and optimization. Unlock the Potential of Programming for Innovation and Efficiency.  Transform raw data into actionable insights effortlessly. Empower Your Data Strategy with Power Dataware: Unleash the Potential of Data for Strategic Insights and Decision Making.

Relationships between tables

In Power BI, relationships between tables are essential for creating accurate and insightful reports. These relationships define how data from different tables interact with each other when performing analyses or creating visualizations. Here's a detailed overview of how relationships between tables work in Power BI: Types of Relationships: One-to-one (1:1):   This is the most common type of relationship in Power BI. It signifies that one record in a table can have multiple related records in another table. For example, each customer can have multiple orders. Many-to-One (N:1):   This relationship type is essentially the reverse of a one-to-many relationship. Many records in one table can correspond to one record in another table. For instance, multiple orders belong to one customer. One-to-Many (1:N):   Power BI doesn't support direct one-to-many relationships.  One record in table can correspond to many records in another table.  Many-to-Many (N:N):  ...

SQL Fundamentals

SQL, or Structured Query Language, is the go-to language for managing relational databases. It allows users to interact with databases to retrieve, manipulate, and control data efficiently. SQL provides a standardized way to define database structures, perform data operations, and ensure data integrity. From querying data to managing access and transactions, SQL is a fundamental tool for anyone working with databases. 1. Basics of SQL Introduction : SQL (Structured Query Language) is used for managing and manipulating relational databases. SQL Syntax : Basic structure of SQL statements (e.g., SELECT, INSERT, UPDATE, DELETE). Data Types : Different types of data that can be stored (e.g., INTEGER, VARCHAR, DATE). 2. SQL Commands DDL (Data Definition Language) : CREATE TABLE : Define new tables. ALTER TABLE : Modify existing tables. DROP TABLE : Delete tables. DML (Data Manipulation Language) : INSERT : Add new records. UPDATE : Modify existing records. DELETE : Remove records. DQL (Da...