Merging datasets in Power BI allows you to combine two or more tables into a single table based on a common field. This is useful for enriching your data with additional information or for performing complex data analysis. The merging process in Power BI is similar to SQL joins (like INNER JOIN, LEFT JOIN, etc.). Here’s a detailed guide on how to merge datasets in Power BI with an example.
Example
Suppose we have two datasets:
- Sales Data
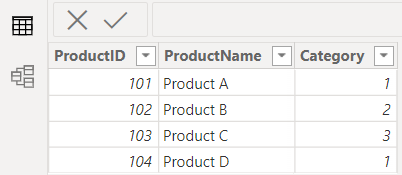
- Product Details
Step 1: Load Data into Power BI
Open PowerBI Desktop
Get Data
Click on "Home" > "Get Data" > "Text/CSV".
Import the Sales Data CSV file.
Repeat the process to import the Product Details CSV file.

Step 2: Merge Queries
Go to the Query Editor:
Click on "Home" > "Transform data" to open Power Query Editor.

Merge Queries:
In the Query Editor, select the Sales Data table.
Click on "Home" > "Merge Queries".
In the Merge window, select Product Details as the second table.
Select the common column
ProductID from both tables to join on. Choose the type of join (e.g., "Left Outer" to include all rows from Sales Data and matching rows from Product Details).

Expand the Merge Table:
After merging, an "Expand" button will appear in the new column.
Click on the "Expand" button.
Select the columns you want to include from the Product Details table (e.g.,
ProductName and Category). Click "OK".

Apply changes:
Click "Close & Apply" to load the merged data back into Power BI.

Step 3: Create a Visual Using Merged Data
Create a Table Visual:
In the "Report" view, select the table visual from the "Visualizations" pane.
Drag
OrderID, ProductName, Category, SalesAmount, and Date to the table fields.
Analyze the Data:
The table will now display the merged data, showing sales information along with product details.

Merging datasets in Power BI is a powerful way to combine data from different sources, enabling more comprehensive data analysis. By following the steps above, you can merge tables using common columns and create rich, insightful reports.
Comments
Post a Comment