Sorting in Power BI allows you to organize your data in a meaningful order within visuals and reports. Sorting can be applied to different types of visuals like tables, matrices, and charts to enhance the clarity and analysis of data. Here’s a comprehensive guide on how to sort data in Power BI, complete with examples.
Types of Sorting in Power BI
- Ascending and Descending Order
- Sorting by Column
- Sorting by Measure
- Custom Sorting (using calculated columns or sort by another column)
Example
Let's use the following sample sales dataset:

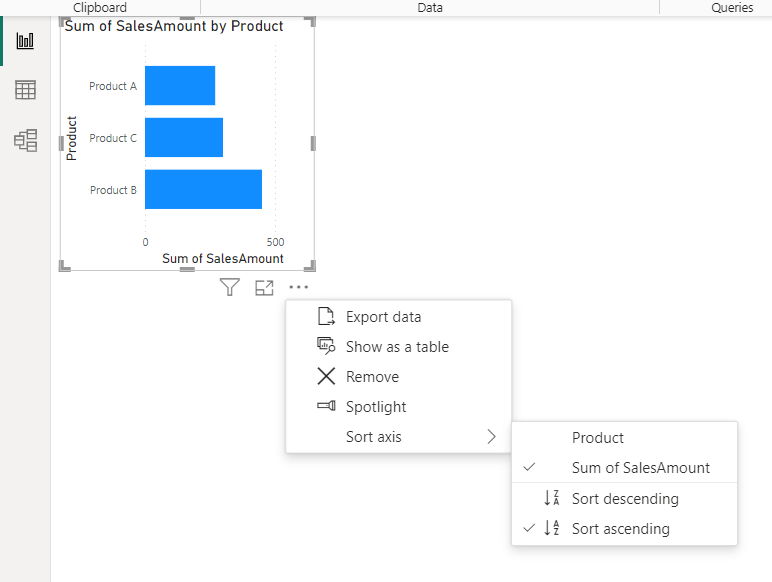
Sorting a Bar Chart by Sales Amount
Create a Bar Chart:
- In the "Visualizations" pane, select the bar chart visual.
- Drag "Product" to the "X axis" and "SalesAmount" to the "Y axis" field.
Sort by Sales Amount:
- Click on the ellipsis (three dots) in the top right corner of the bar chart visual.
- Select "Sort by" and choose "SalesAmount".
- Choose "Descending" or "Ascending" to sort the products by their total sales amount in descending or ascending order.
Sorting a Table by Date
Create a Table
- In the "Visualizations" pane, select the table visual.
- Drag "Date", "Product", "SalesAmount", and "Region" to the table fields.
Sort by Date:
- Click on the column header "Date" in the table.
- The table will sort by date in ascending order by default. Click again to toggle to descending order.

Sorting by a Custom Order (Using a Calculated Column)
Suppose you want to sort products in a specific order: Product B, Product A, Product C. You can achieve this by creating a calculated column for custom sorting.
Create a Calculated Column for Sorting Order:
Go to the "Table" view.
Click "New column" and enter the following DAX formula:
- SortOrder = SWITCH([Product],"Product B", 1,"Product A", 2,"Product C", 3,9999)

Set the Sort Order for the Product Column:
- Go to the "Table" view.
- Select the "Date" column.
- In the ribbon, click "Sort by Column" and choose "SortOrder"

Sort a Visual Using the Custom Order:
- Create a table or bar chart visual.
- Add the "Product" and "SalesAmount" fields.
- The products will now be sorted based on "Product" column.

Create a Matrix:
- In the "Visualizations" pane, select the matrix visual.
- Drag "Region" to the "Rows" field and "Product" to the "Columns" field.
- Drag "SalesAmount" to the "Values" field.

Sort by Sales Amount:
- Click on the column header for "SalesAmount" in the matrix.
- The matrix will sort the regions based on the total sales amount in ascending order by default. Click again to toggle to descending order.

Comments
Post a Comment